
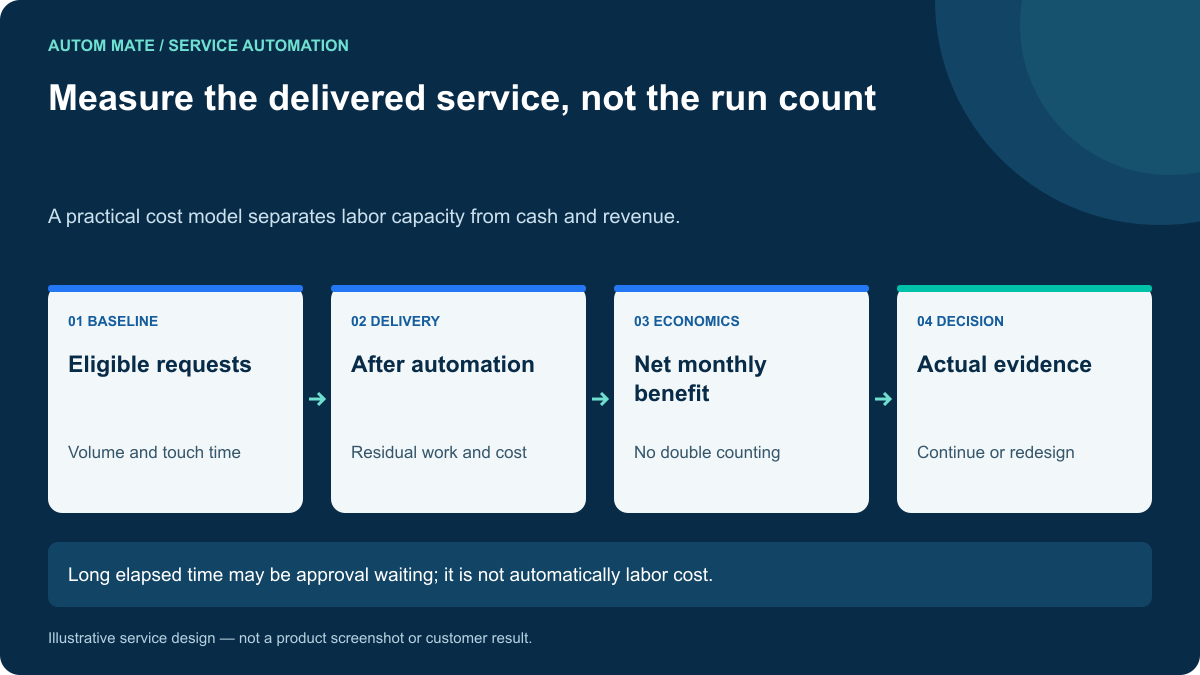
MSP automation ROI should compare the full cost of delivering a defined service before and after automation. A workflow run count is not a saving. Technician time released is useful capacity, but it becomes cash benefit only through a credible change in cost or productive output.
A good model makes those distinctions visible enough for operations, finance and sales to challenge. It also identifies when a promising automation is too expensive to maintain for the request volume it serves.
Choose a service-sized unit of analysis
Start with one repeatable service: standard application access, routine device remediation or a monthly license review. Count eligible requests for that service, not every ticket in the help desk. Agree what “delivered” means before measuring either manual or automated performance.
Separate active handling from waiting. A request that lasts five days might involve ten minutes of technician work and several days awaiting approval. Removing the waiting can improve experience without releasing five days of labor.
A worked example with explicit assumptions
The following numbers are illustrative assumptions, not Autom Mate prices or observed customer results. Consider 400 eligible requests per month. Manual delivery takes 12 active minutes per request. After automation, the average falls to three minutes, including the residual handling spread across all requests.
| Measure | Calculation | Illustrative result |
|---|---|---|
| Manual effort | 400 × 12 ÷ 60 | 80 hours/month |
| Residual effort | 400 × 3 ÷ 60 | 20 hours/month |
| Capacity released | 80 − 20 | 60 hours/month |
| Capacity value at $45/hour | 60 × $45 | $2,700/month |
| Platform, execution and maintenance | Assumed combined incremental cost | $900/month |
| Net capacity value | $2,700 − $900 | $1,800/month |
If one-time implementation costs $5,400, the simple payback using that capacity valuation is three months. That is not automatically a three-month cash payback. If salaries remain unchanged and the released time is unused, the business has gained available capacity rather than an equivalent reduction in its bank outgoings.
State how you intend to realize the benefit: reduce overtime, avoid a planned hire, increase billable delivery or absorb customer growth with the same team. Validate that the planned demand exists.
Include the costs a demo does not show
Account for implementation, customer setup, connection maintenance, monitoring, exceptions, vendor charges and periodic changes to the service. Estimate one-time costs separately from recurring costs. An automation that needs a specialist to repair it every week can look attractive when only execution fees are counted.
Allocate shared platform cost consistently. You might use active execution, customer allocation or another documented driver. Avoid dividing by successful runs if one customer generates most of the exceptions and support work; that can hide an unprofitable delivery pattern.
Keep any assumed license price clearly labeled until a commercial quote exists. The commercial unit could differ from the unit your operations team uses to compare services.
Stress-test adoption and exception rates
The example assumes all 400 requests follow the designed service. If only 200 are eligible or adopted, the released capacity falls to 30 hours. At the same hourly value, that is $1,350 before the assumed $900 cost, leaving $450 of net monthly capacity value. The illustrative implementation payback then becomes twelve months.
Similarly, a rising exception rate increases average residual handling. Measure the actual average across the whole eligible population, including requests that required manual recovery. Reporting only successful automated runs selects the easiest work and inflates the benefit.
Test low, expected and high volume scenarios. The purpose is to identify which assumptions control the decision, not to make the largest number look convincing.
Connect the model to recurring service revenue
An MSP may sell a service outcome rather than simply use automation internally. In that case, calculate customer revenue, direct delivery costs and the support commitment. A technically efficient service can still be underpriced if the contract promises extensive customization or manual assistance.
Do not count the same released hour twice. If it enables new billable work, model the contribution from that work and its delivery costs; do not also claim the entire hour as a payroll reduction. Keep retention or improved customer satisfaction as separate hypotheses until there is evidence.
Customer-level reporting should explain volume, exceptions and operator effort. That helps account managers discuss scope changes using evidence instead of a generic “automation usage” figure.
A practical go/no-go review
- Is the eligible request volume based on a real period?
- Does residual handling include failures and support?
- Is the hourly rate a loaded cost, billing rate or opportunity value?
- Have implementation and maintenance both been included?
- Can released capacity be used for a specific purpose?
- Does the conclusion survive lower adoption?
Continue when the observed service meets its quality requirements and the economics remain credible. Redesign when exceptions consume the benefit. Stop an unsuitable scope when the maintenance burden cannot be justified by its volume or business value.
Build the model around your first service
Use our MSP workflow evaluation guide to connect the commercial model to a practical demonstration. Bring a month of one service’s request volume and handling estimates; we can map the workflow and identify what the pilot must measure before you commit to wider rollout.